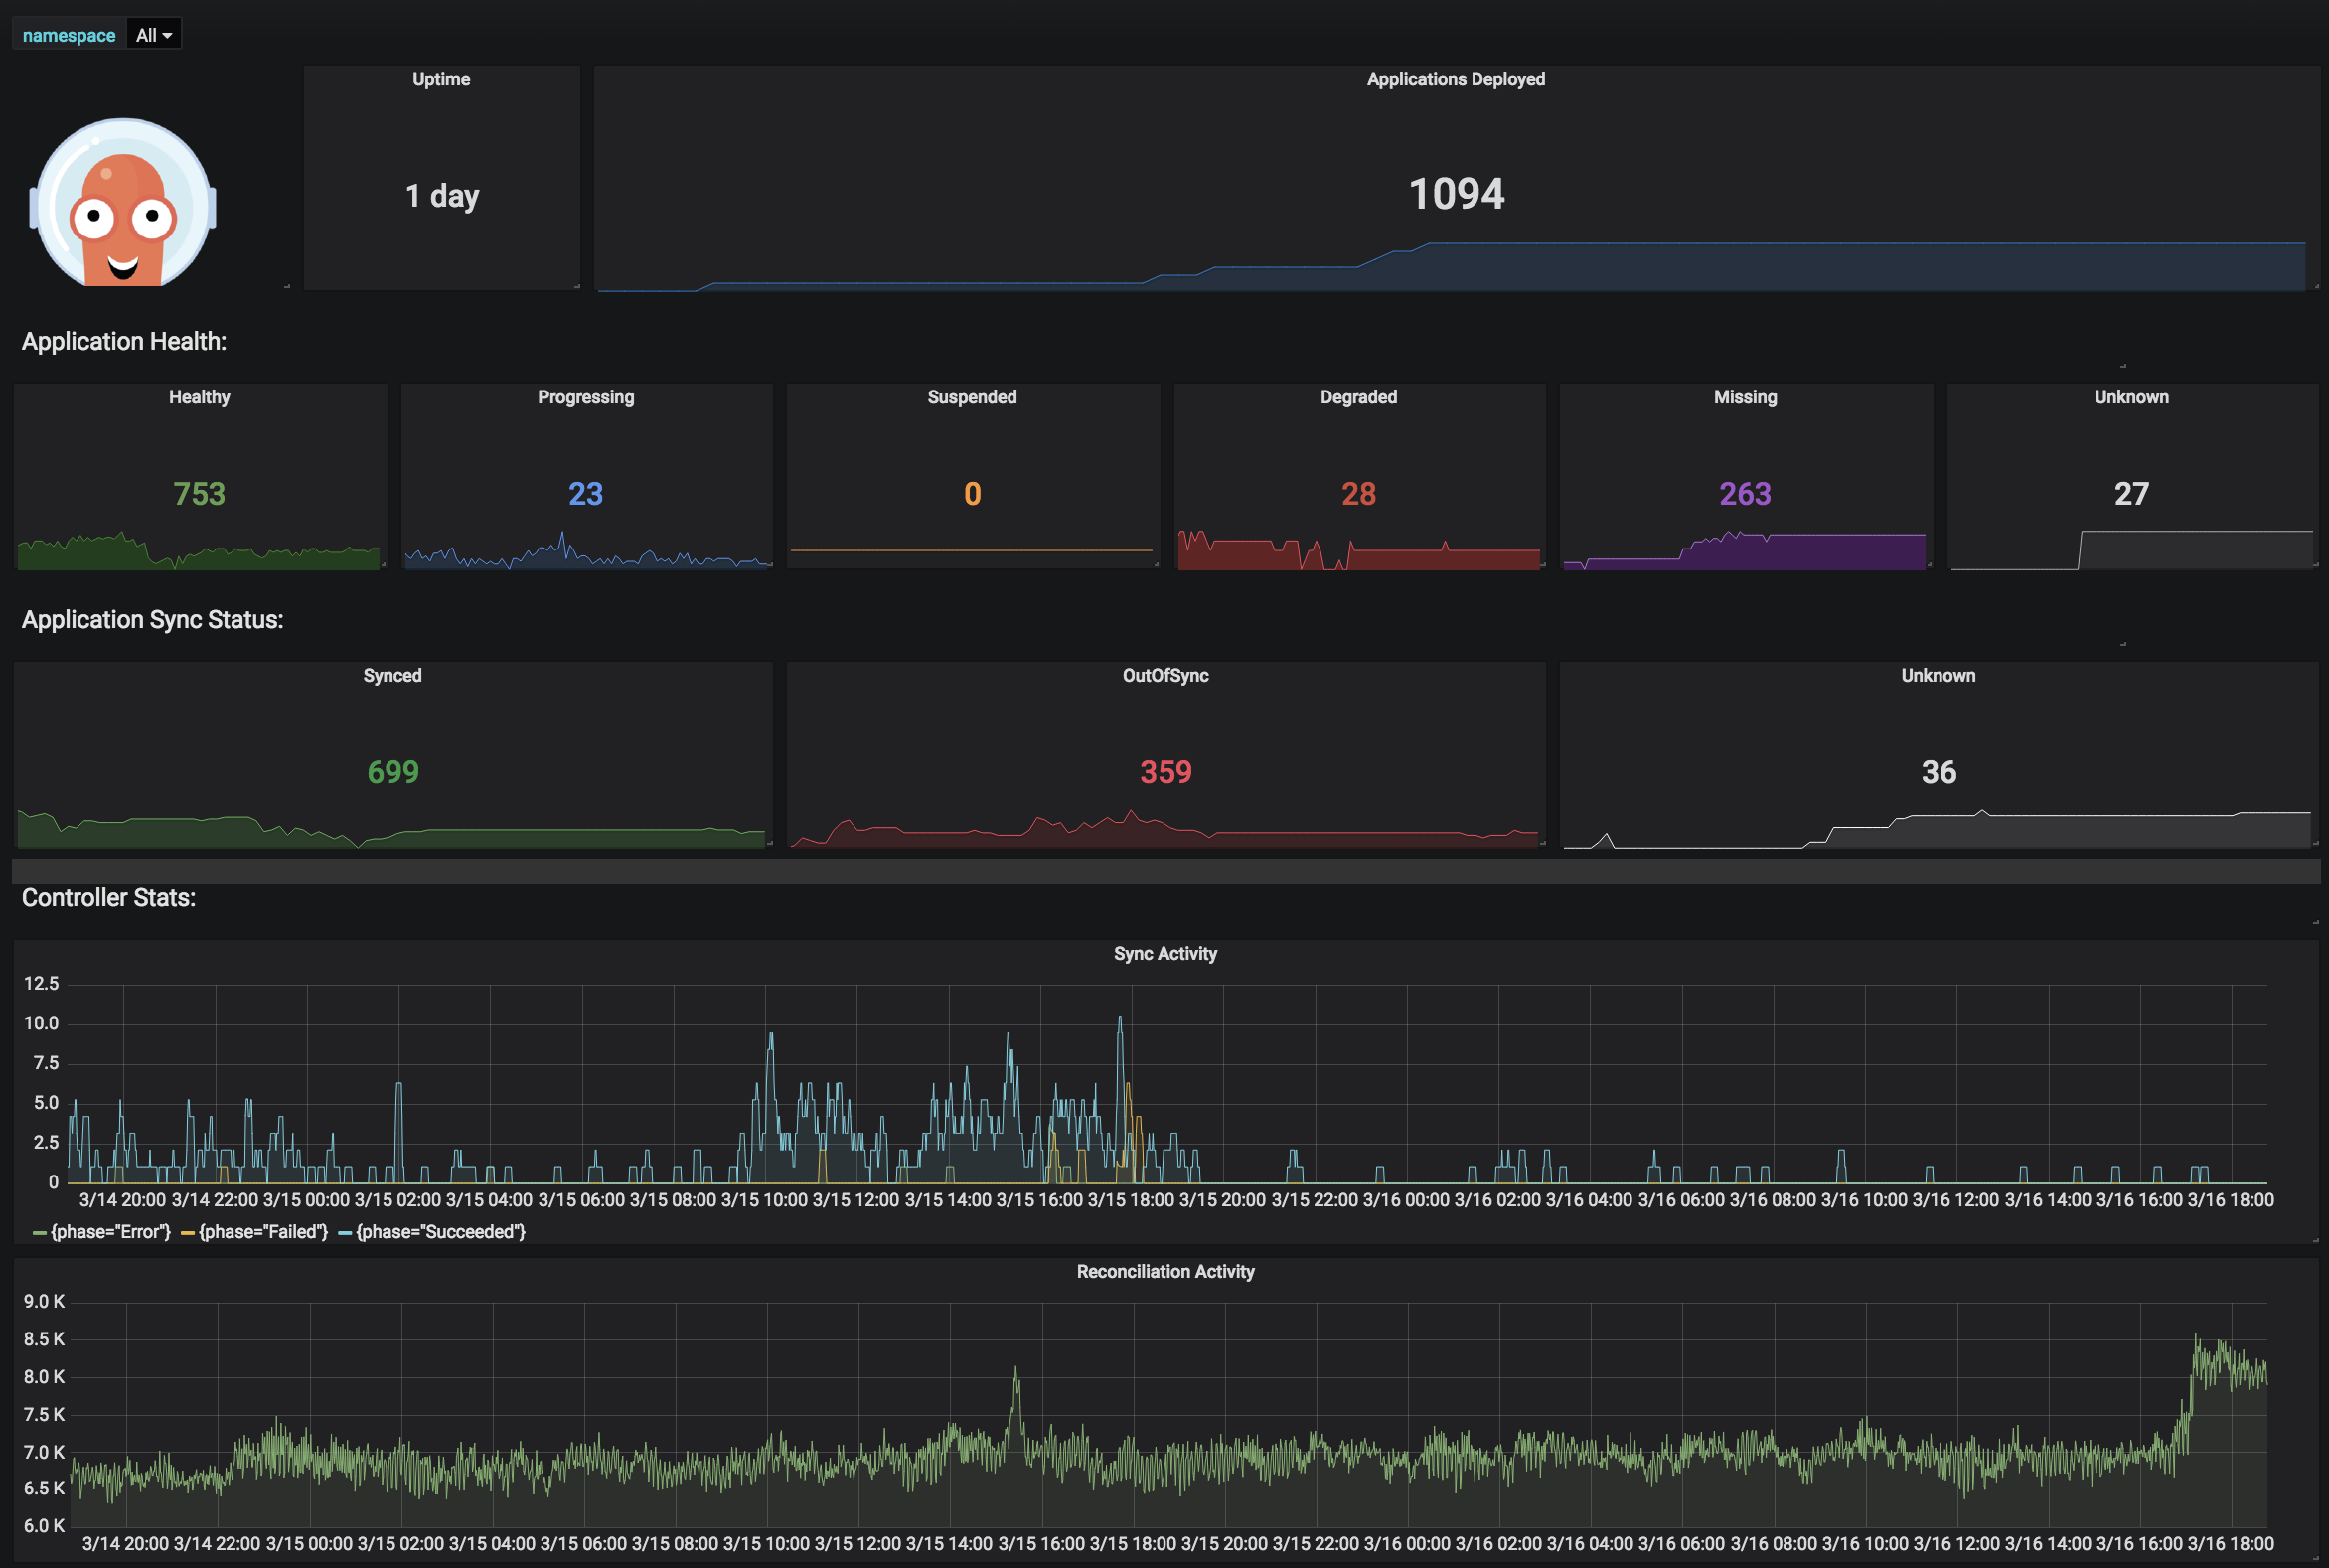
Metrics
Argo CD exposes two sets of Prometheus metrics
Application Metrics
Metrics about applications. Scraped at the argocd-metrics:8082/metrics endpoint.
- Gauge for application health status
- Gauge for application sync status
- Counter for application sync history
API Server Metrics
Metrics about API Server API request and response activity (request totals, response codes, etc...).
Scraped at the argocd-server-metrics:8083/metrics endpoint.
Prometheus Operator
If using Prometheus Operator, the following ServiceMonitor example manifests can be used.
Change metadata.labels.release to the name of label selected by your Prometheus.
apiVersion: monitoring.coreos.com/v1
kind: ServiceMonitor
metadata:
  name: argocd-metrics
  labels:
    release: prometheus-operator
spec:
  selector:
    matchLabels:
      app.kubernetes.io/name: argocd-metrics
  endpoints:
  - port: metrics
apiVersion: monitoring.coreos.com/v1
kind: ServiceMonitor
metadata:
  name: argocd-server-metrics
  labels:
    release: prometheus-operator
spec:
  selector:
    matchLabels:
      app.kubernetes.io/name: argocd-server-metrics
  endpoints:
  - port: metrics
apiVersion: monitoring.coreos.com/v1
kind: ServiceMonitor
metadata:
  name: argocd-repo-server-metrics
  labels:
    release: prometheus-operator
spec:
  selector:
    matchLabels:
      app.kubernetes.io/name: argocd-repo-server
  endpoints:
  - port: metrics
Dashboards
You can find an example Grafana dashboard here or check demo instance dashboard.
