Metrics
Argo CD exposes two sets of Prometheus metrics
Application Metrics
Metrics about applications. Scraped at the argocd-metrics:8082/metrics endpoint.
- Gauge for application health status
- Gauge for application sync status
- Counter for application sync history
If you use ArgoCD with many application and project creation and deletion,
the metrics page will keep in cache your application and project's history.
If you are having issues because of a large number of metrics cardinality due
to deleted resources, you can schedule a metrics reset to clean the
history with an application controller flag. Example:
--metrics-cache-expiration="24h0m0s".
API Server Metrics
Metrics about API Server API request and response activity (request totals, response codes, etc...).
Scraped at the argocd-server-metrics:8083/metrics endpoint.
Prometheus Operator
If using Prometheus Operator, the following ServiceMonitor example manifests can be used.
Change metadata.labels.release to the name of label selected by your Prometheus.
apiVersion: monitoring.coreos.com/v1
kind: ServiceMonitor
metadata:
  name: argocd-metrics
  labels:
    release: prometheus-operator
spec:
  selector:
    matchLabels:
      app.kubernetes.io/name: argocd-metrics
  endpoints:
  - port: metrics
apiVersion: monitoring.coreos.com/v1
kind: ServiceMonitor
metadata:
  name: argocd-server-metrics
  labels:
    release: prometheus-operator
spec:
  selector:
    matchLabels:
      app.kubernetes.io/name: argocd-server-metrics
  endpoints:
  - port: metrics
apiVersion: monitoring.coreos.com/v1
kind: ServiceMonitor
metadata:
  name: argocd-repo-server-metrics
  labels:
    release: prometheus-operator
spec:
  selector:
    matchLabels:
      app.kubernetes.io/name: argocd-repo-server-metrics
  endpoints:
  - port: metrics
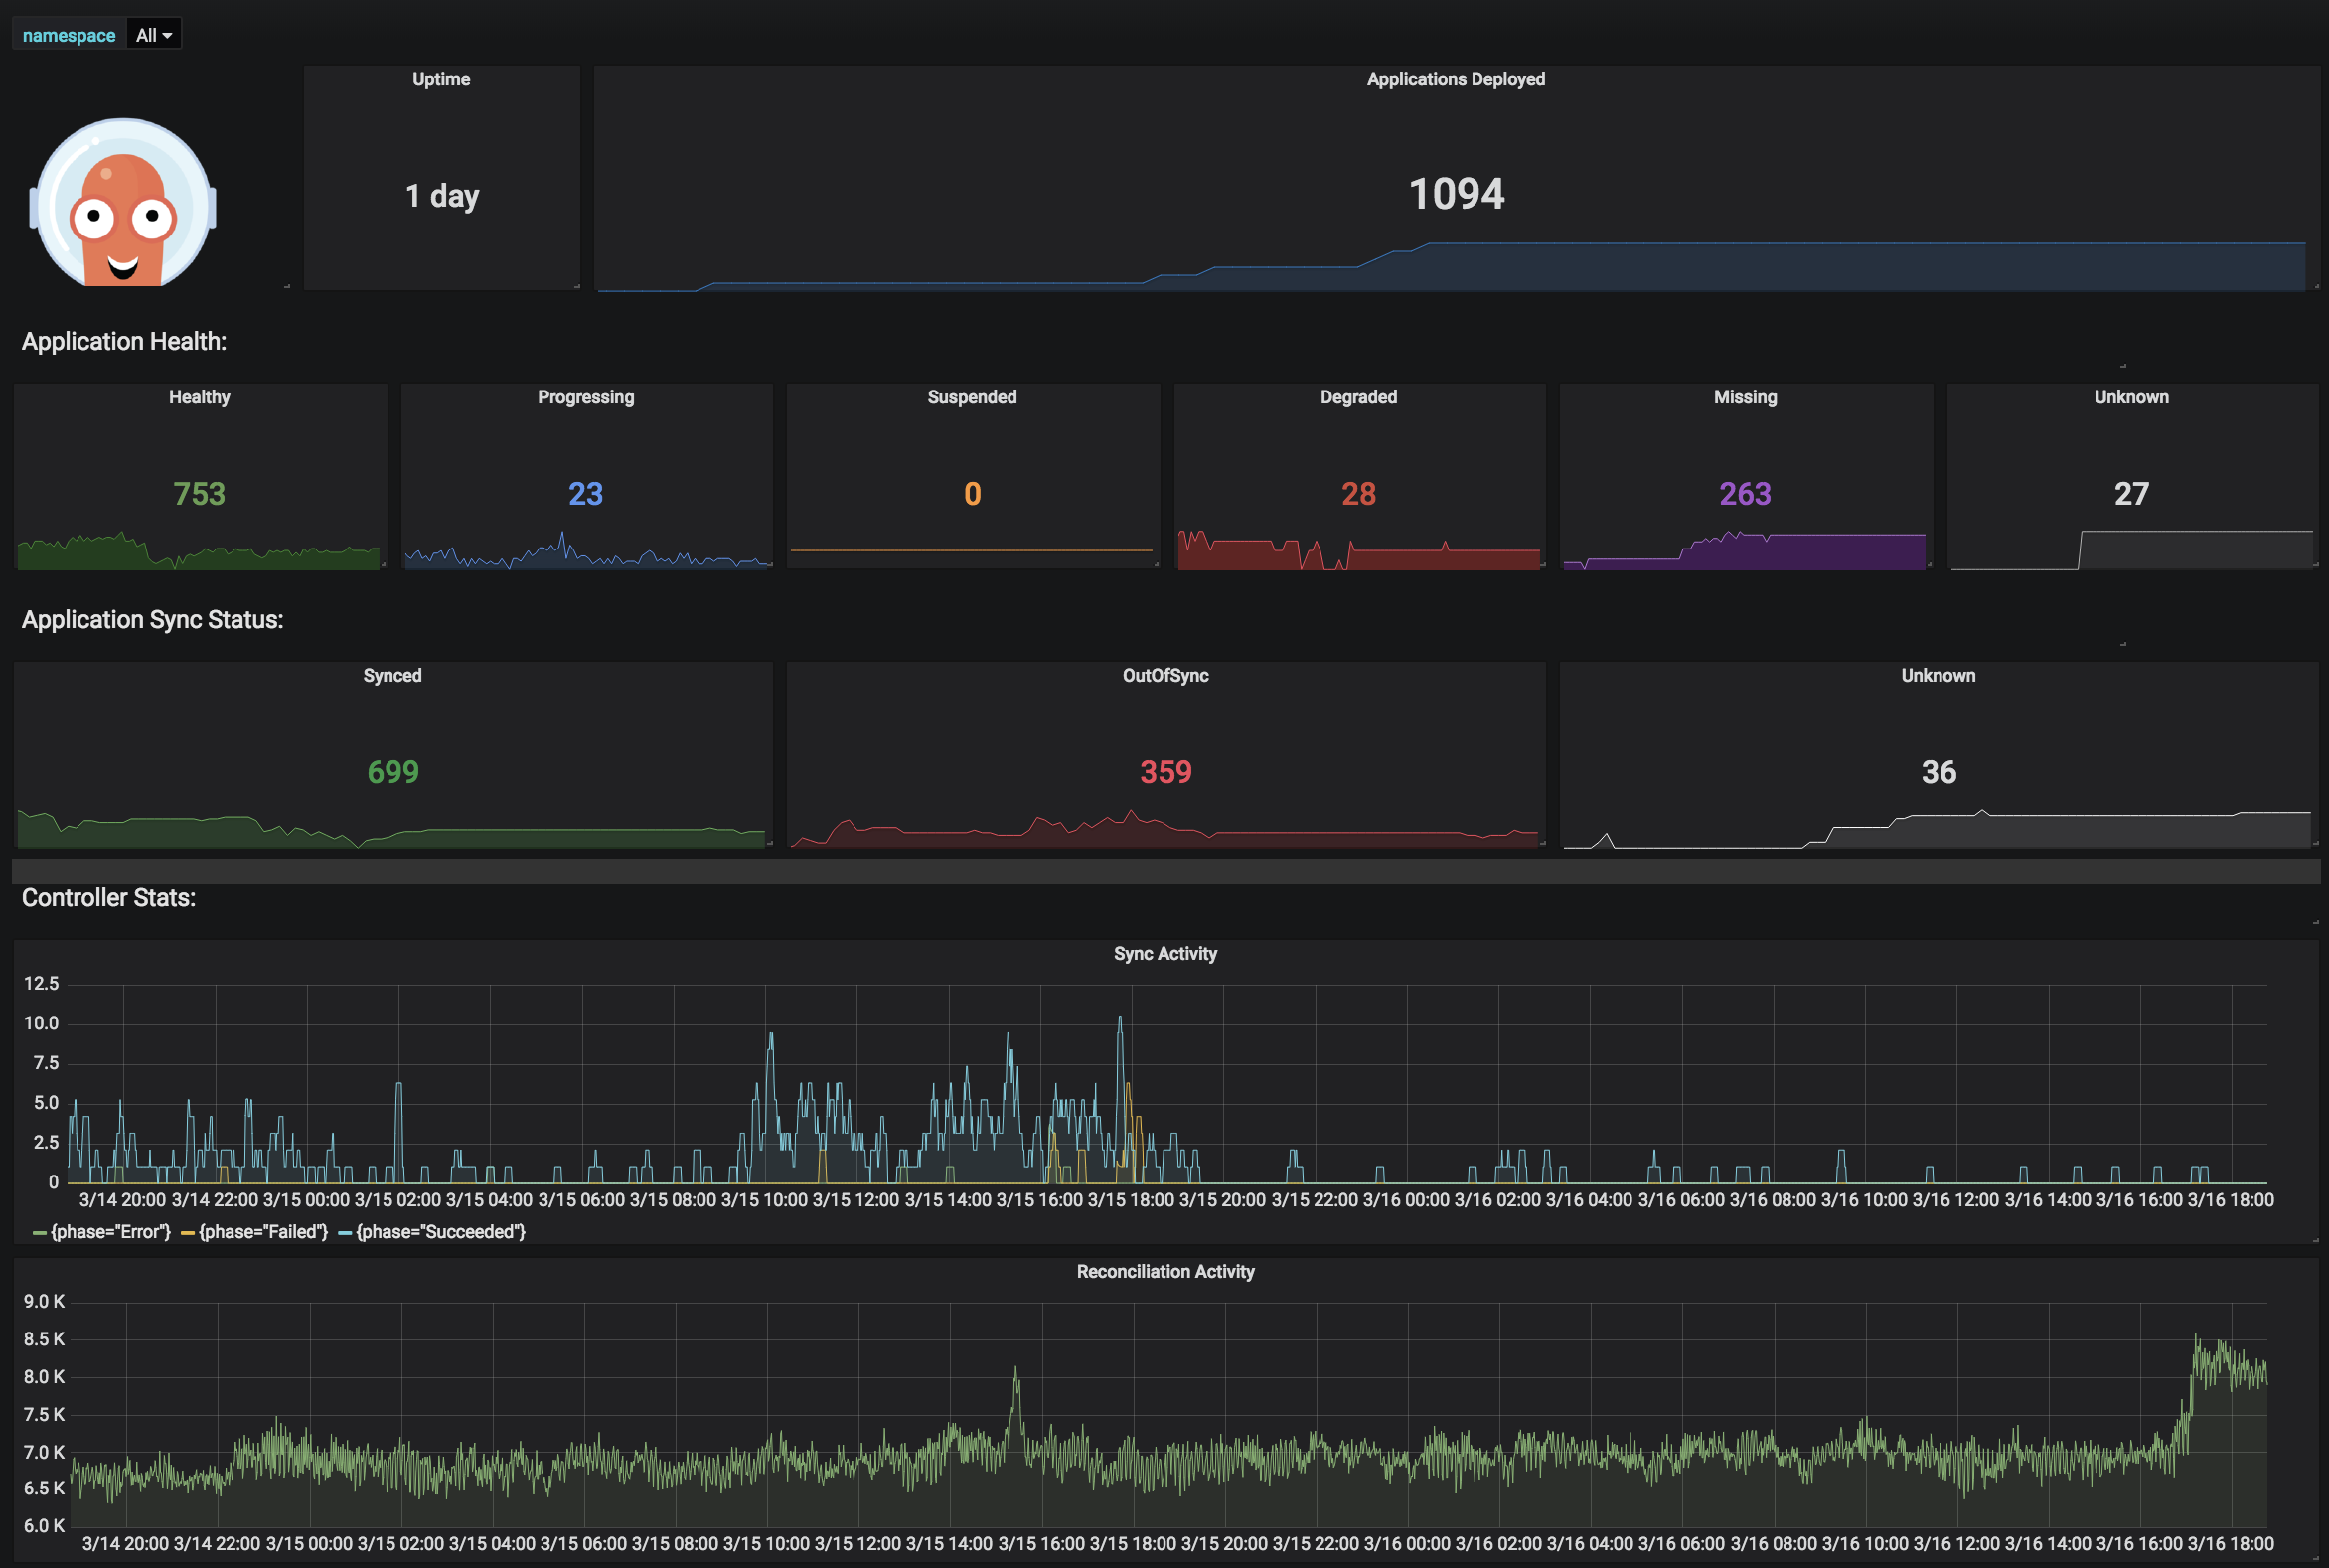
Dashboards
You can find an example Grafana dashboard here or check demo instance dashboard.