Metrics
Argo CD exposes different sets of Prometheus metrics per server.
Application Controller Metrics
Metrics about applications. Scraped at the argocd-metrics:8082/metrics endpoint.
| Metric | Type | Description |
|---|---|---|
argocd_app_info |
gauge | Information about Applications. It contains labels such as sync_status and health_status that reflect the application state in Argo CD. |
argocd_app_condition |
gauge | Report Applications conditions. It contains the conditions currently present in the application status. |
argocd_app_k8s_request_total |
counter | Number of Kubernetes requests executed during application reconciliation |
argocd_app_labels |
gauge | Argo Application labels converted to Prometheus labels. Disabled by default. See section below about how to enable it. |
argocd_app_orphaned_resources_count |
gauge | Number of orphaned resources per application. |
argocd_app_reconcile |
histogram | Application reconciliation performance in seconds. |
argocd_app_sync_total |
counter | Counter for application sync history |
argocd_app_sync_duration_seconds_total |
counter | Application sync performance in seconds total. |
argocd_cluster_api_resource_objects |
gauge | Number of k8s resource objects in the cache. |
argocd_cluster_api_resources |
gauge | Number of monitored Kubernetes API resources. |
argocd_cluster_cache_age_seconds |
gauge | Cluster cache age in seconds. |
argocd_cluster_connection_status |
gauge | The k8s cluster current connection status. |
argocd_cluster_events_total |
counter | Number of processes k8s resource events. |
argocd_cluster_info |
gauge | Information about cluster. |
argocd_redis_request_duration |
histogram | Redis requests duration. |
argocd_redis_request_total |
counter | Number of redis requests executed during application reconciliation |
argocd_resource_events_processing |
histogram | Time to process resource events in batch in seconds |
argocd_resource_events_processed_in_batch |
gauge | Number of resource events processed in batch |
argocd_kubectl_exec_pending |
gauge | Number of pending kubectl executions |
argocd_kubectl_exec_total |
counter | Number of kubectl executions |
argocd_kubectl_client_cert_rotation_age_seconds |
gauge | Age of kubectl client certificate rotation. |
argocd_kubectl_request_duration_seconds |
histogram | Latency of kubectl requests. |
argocd_kubectl_dns_resolution_duration_seconds |
histogram | Latency of kubectl resolver. |
argocd_kubectl_request_size_bytes |
histogram | Size of kubectl requests. |
argocd_kubectl_response_size_bytes |
histogram | Size of kubectl responses. |
argocd_kubectl_rate_limiter_duration_seconds |
histogram | Latency of kubectl rate limiter. |
argocd_kubectl_requests_total |
counter | Result of kubectl requests. |
argocd_kubectl_exec_plugin_call_total |
counter | Number of kubectl exec plugin calls. |
argocd_kubectl_request_retries_total |
counter | Number of kubectl request retries. |
argocd_kubectl_transport_cache_entries |
gauge | Number of kubectl transport cache entries. |
argocd_kubectl_transport_create_calls_total |
counter | Number of kubectl transport create calls. |
Labels
| Label Name | Example Value | Description |
|---|---|---|
| call_status | no_error | Status of the kubectl exec plugin call. Possible values are: no_error, plugin_execution_error, plugin_not_found_error, client_internal_error. |
| code | 200 | HTTP status code returned by the request or exit code of a command. kubectl metrics produced by client-go use code for HTTP responses, while metrics produced by Argo CD use response_code. |
| command | apply | kubectl command executed. Possible values are: apply, auth, create, replace. |
| dest_server | https://example.com | Destination server for an Application. |
| failed | false | Indicates if the Redis request failed. Possible values are: true, false. |
| group | apps | Group name of a Kubernetes resource being monitored. |
| host | example.com | Hostname of the Kubernetes API to which the request was made. |
| hostname | argocd-application-controller-0 | Hostname of the Argo CD component that initiated the request to Redis. |
| initiator | argocd-server | Name of the Argo CD component that initiated the request to Redis. Possible values are: argocd-application-controller, argocd-repo-server, argocd-server. |
| kind | Deployment | Kind name of a Kubernetes resource being monitored. |
| method | GET | HTTP method used for the request. Possible values are: GET, DELETE, PATCH, POST, PUT. |
| name | my-app | Name of an Application. |
| namespace | default | Namespace of an Application (namespace where the Application CR is located, not the destination namespace). |
| phase | Succeeded | Phase of a sync operation. Possible values are: Error, Failed, Running, Succeeded, Terminating. |
| project | my-project | AppProject of an Application. |
| resource_kind | Pod | Kind of Kubernetes resource being synced. |
| resource_namespace | default | Namespace of Kubernetes resource being synced. |
| response_code | 404 | HTTP response code from the server. |
| result | hit | Result of an attempt to get a transport from the kubectl (client-go) transport cache. Possible values are: hit, miss, unreachable. |
| server | https://example.com | Server where the operation is performed. |
| verb | List | Kubernetes API verb used in the request. Possible values are: Get, Watch, List, Create, Delete, Patch, Update. |
Metrics Cache Expiration
If you use Argo CD with many application and project creation and deletion,
the metrics page will keep in cache your application and project's history.
If you are having issues because of a large number of metrics cardinality due
to deleted resources, you can schedule a metrics reset to clean the
history with an application controller flag. Example:
--metrics-cache-expiration="24h0m0s".
Exposing Application labels as Prometheus metrics
There are use-cases where Argo CD Applications contain labels that are desired to be exposed as Prometheus metrics. Some examples are:
- Having the team name as a label to allow routing alerts to specific receivers
- Creating dashboards broken down by business units
As the Application labels are specific to each company, this feature is disabled by default. To enable it, set the
comma-separated controller.metrics.application.labels key in the argocd-cmd-params-cm ConfigMap.
The example below will expose the Argo CD Application labels team-name and business-unit to Prometheus:
controller.metrics.application.labels: "team-name,business-unit"
Warning
Each distinct label value becomes a separate argocd_app_labels time series. Exposing labels with many distinct values increases the metric's cardinality, which can degrade Prometheus performance and increase storage requirements. Prefer low-cardinality labels and add them sparingly.
Alternatively, the labels can be passed as --metrics-application-labels flags directly to the application controller:
containers:
- command:
  - argocd-application-controller
  - --metrics-application-labels
  - team-name
  - --metrics-application-labels
  - business-unit
In either case, the metric would look like:
# TYPE argocd_app_labels gauge
argocd_app_labels{label_business_unit="bu-id-1",label_team_name="my-team",name="my-app-1",namespace="argocd",project="important-project"} 1
argocd_app_labels{label_business_unit="bu-id-1",label_team_name="my-team",name="my-app-2",namespace="argocd",project="important-project"} 1
argocd_app_labels{label_business_unit="bu-id-2",label_team_name="another-team",name="my-app-3",namespace="argocd",project="important-project"} 1
Exposing Application conditions as Prometheus metrics
There are use-cases where Argo CD Applications contain conditions that are desired to be exposed as Prometheus metrics. Some examples are:
- Hunting orphaned resources across all deployed applications
- Knowing which resources are excluded from ArgoCD
As the Application conditions are specific to each company, this feature is disabled by default. To enable it, set the
comma-separated controller.metrics.application.conditions key in the argocd-cmd-params-cm ConfigMap.
The example below will expose the Argo CD Application condition OrphanedResourceWarning and ExcludedResourceWarning to Prometheus:
controller.metrics.application.conditions: "OrphanedResourceWarning,ExcludedResourceWarning"
Alternatively, the conditions can be passed as --metrics-application-conditions flags directly to the application controller:
containers:
  - command:
      - argocd-application-controller
      - --metrics-application-conditions
      - OrphanedResourceWarning
      - --metrics-application-conditions
      - ExcludedResourceWarning
Exposing Cluster labels as Prometheus metrics
As the Cluster labels are specific to each company, this feature is disabled by default. To enable it, set the
comma-separated controller.metrics.cluster.labels key in the argocd-cmd-params-cm ConfigMap.
The example below will expose the Argo CD cluster labels team-name and environment to Prometheus:
controller.metrics.cluster.labels: "team-name,environment"
Alternatively, the labels can be passed as --metrics-cluster-labels flags directly to the application controller:
containers:
- command:
  - argocd-application-controller
  - --metrics-cluster-labels
  - team-name
  - --metrics-cluster-labels
  - environment
In either case, the metric would look like:
# TYPE argocd_cluster_labels gauge
argocd_cluster_labels{label_environment="dev",label_team_name="team1",name="cluster1",server="server1"} 1
argocd_cluster_labels{label_environment="staging",label_team_name="team2",name="cluster2",server="server2"} 1
argocd_cluster_labels{label_environment="production",label_team_name="team3",name="cluster3",server="server3"} 1
Application Set Controller metrics
The Application Set controller exposes the following metrics for application sets.
| Metric | Type | Description |
|---|---|---|
argocd_appset_info |
gauge | Information about Application Sets. It contains labels for the name and namespace of an application set as well as Resource_update_status that reflects the ResourcesUpToDate property |
argocd_appset_reconcile |
histogram | Application reconciliation performance in seconds. It contains labels for the name and namespace of an applicationset |
argocd_appset_labels |
gauge | Applicationset labels translated to Prometheus labels. Disabled by default |
argocd_appset_owned_applications |
gauge | Number of applications owned by the applicationset. It contains labels for the name and namespace of an applicationset. |
argocd_kubectl_client_cert_rotation_age_seconds |
gauge | Age of kubectl client certificate rotation. |
argocd_kubectl_request_duration_seconds |
histogram | Latency of kubectl requests. |
argocd_kubectl_dns_resolution_duration_seconds |
histogram | Latency of kubectl resolver. |
argocd_kubectl_request_size_bytes |
histogram | Size of kubectl requests. |
argocd_kubectl_response_size_bytes |
histogram | Size of kubectl responses. |
argocd_kubectl_rate_limiter_duration_seconds |
histogram | Latency of kubectl rate limiter. |
argocd_kubectl_requests_total |
counter | Result of kubectl requests. |
argocd_kubectl_exec_plugin_call_total |
counter | Number of kubectl exec plugin calls. |
argocd_kubectl_request_retries_total |
counter | Number of kubectl request retries. |
argocd_kubectl_transport_cache_entries |
gauge | Number of kubectl transport cache entries. |
argocd_kubectl_transport_create_calls_total |
counter | Number of kubectl transport create calls. |
Similar to the same metric in application controller (argocd_app_labels) the metric argocd_appset_labels is disabled by default. You can enable it by providing the –metrics-applicationset-labels argument to the applicationset controller.
Once enabled it works exactly the same as application controller metrics (label_ appended to normalized label name). Available labels include Name, Namespace + all labels enabled by the command line options and their value (exactly like application controller metrics described in the previous section). |
Application Set GitHub API metrics
All the following argocd_github_api_* metrics can be enabled upon setting applicationsetcontroller.enable.github.api.metrics: true in argocd-cmd-params-cm ConfigMap. Note that they are disabled by default.
| Metric | Type | Description |
|---|---|---|
argocd_github_api_requests_total |
counter | Number of Github API calls. It contains labels for the name and namespace of an applicationset. |
argocd_github_api_request_duration_seconds |
histogram | Github API request duration. It contains labels for the name and namespace of an applicationset. |
argocd_github_api_rate_limit_remaining |
gauge | The number of requests remaining in the current rate limit window. It contains labels for the name and namespace of an applicationset, and for the rate limit resource. |
argocd_github_api_rate_limit_limit |
gauge | The maximum number of requests that you can make per hour. It contains labels for the name and namespace of an applicationset, and for the rate limit resource. |
argocd_github_api_rate_limit_reset_seconds |
gauge | The time left till the current rate limit window resets, in seconds. It contains labels for the name and namespace of an applicationset, and for the rate limit resource. |
argocd_github_api_rate_limit_used |
gauge | The number of requests used in the current rate limit window. It contains labels for the name and namespace of an applicationset, and for the rate limit resource. |
Labels
| Label Name | Example Value | Description |
|---|---|---|
| call_status | no_error | Status of the kubectl exec plugin call. Possible values are: no_error, plugin_execution_error, plugin_not_found_error, client_internal_error. |
| code | 200 | HTTP status code returned by the request or exit code of a command. |
| host | example.com | Hostname of the Kubernetes API to which the request was made. |
| method | GET | HTTP method used for the request. Possible values are: GET, DELETE, PATCH, POST, PUT. |
| name | my-app | Name of an ApplicationSet. |
| namespace | default | Namespace of an ApplicationSet (namespace where the ApplicationSet CR is located, not the destination namespace). |
| result | hit | Result of an attempt to get a transport from the kubectl (client-go) transport cache. Possible values are: hit, miss, unreachable. |
| verb | List | Kubernetes API verb used in the request. Possible values are: Get, Watch, List, Create, Delete, Patch, Update. |
API Server Metrics
Metrics about API Server API request and response activity (request totals, response codes, etc...).
Scraped at the argocd-server-metrics:8083/metrics endpoint.
For GRPC metrics to show up environment variable ARGOCD_ENABLE_GRPC_TIME_HISTOGRAM must be set to true.
| Metric | Type | Description |
|---|---|---|
argocd_login_request_total |
counter | Number of login requests. |
argocd_redis_request_duration |
histogram | Redis requests duration. |
argocd_redis_request_total |
counter | Number of Kubernetes requests executed during application reconciliation. |
grpc_server_handled_total |
counter | Total number of RPCs completed on the server, regardless of success or failure. |
grpc_server_msg_sent_total |
counter | Total number of gRPC stream messages sent by the server. |
argocd_proxy_extension_request_total |
counter | Number of requests sent to the configured proxy extensions. |
argocd_proxy_extension_request_duration_seconds |
histogram | Request duration in seconds between the Argo CD API server and the proxy extension backend. |
argocd_kubectl_client_cert_rotation_age_seconds |
gauge | Age of kubectl client certificate rotation. |
argocd_kubectl_request_duration_seconds |
histogram | Latency of kubectl requests. |
argocd_kubectl_dns_resolution_duration_seconds |
histogram | Latency of kubectl resolver. |
argocd_kubectl_request_size_bytes |
histogram | Size of kubectl requests. |
argocd_kubectl_response_size_bytes |
histogram | Size of kubectl responses. |
argocd_kubectl_rate_limiter_duration_seconds |
histogram | Latency of kubectl rate limiter. |
argocd_kubectl_requests_total |
counter | Result of kubectl requests. |
argocd_kubectl_exec_plugin_call_total |
counter | Number of kubectl exec plugin calls. |
argocd_kubectl_request_retries_total |
counter | Number of kubectl request retries. |
argocd_kubectl_transport_cache_entries |
gauge | Number of kubectl transport cache entries. |
argocd_kubectl_transport_create_calls_total |
counter | Number of kubectl transport create calls. |
Labels
| Label Name | Example Value | Description |
|---|---|---|
| call_status | no_error | Status of the kubectl exec plugin call. Possible values are: no_error, plugin_execution_error, plugin_not_found_error, client_internal_error. |
| code | 200 | HTTP status code returned by the request or exit code of a command. kubectl metrics produced by client-go use code for HTTP responses, while metrics produced by Argo CD proxy extensions use status. |
| extension | metrics | Name of the proxy extension being called. |
| failed | false | Indicates if the Redis request failed. Possible values are: true, false. |
| host | example.com | Hostname of the Kubernetes API to which the request was made. |
| initiator | argocd-server | Name of the Argo CD component that initiated the request to Redis. Possible values are: argocd-application-controller, argocd-repo-server, argocd-server. |
| method | GET | HTTP method used for the request. Possible values are: GET, DELETE, PATCH, POST, PUT. |
| result | hit | Result of an attempt to get a transport from the kubectl (client-go) transport cache. Possible values are: hit, miss, unreachable. |
| status | 200 | HTTP response code from the extension. |
| verb | List | Kubernetes API verb used in the request. Possible values are: Get, Watch, List, Create, Delete, Patch, Update. |
| version | v2.13.3 | Argo CD version. |
Repo Server Metrics
Metrics about the Repo Server. The gRPC metrics are not exposed by default. Metrics can be enabled using
ARGOCD_ENABLE_GRPC_TIME_HISTOGRAM=true environment variable.
Scraped at the argocd-repo-server:8084/metrics endpoint.
| Metric | Type | Description |
|---|---|---|
argocd_git_request_duration_seconds |
histogram | Git requests duration seconds. |
argocd_git_request_total |
counter | Number of git requests performed by repo server |
argocd_git_fetch_fail_total |
counter | Number of git fetch requests failures by repo server |
argocd_redis_request_duration_seconds |
histogram | Redis requests duration seconds. |
argocd_redis_request_total |
counter | Number of Kubernetes requests executed during application reconciliation. |
argocd_repo_pending_request_total |
gauge | Number of pending requests requiring repository lock |
argocd_repo_parallelism_wait_duration_seconds |
histogram | Time spent waiting for the repo-server manifest generation parallelism semaphore (--parallelismlimit). Observed on every acquire attempt, including those that fail (e.g. context canceled). |
argocd_oci_request_total |
counter | Number of OCI requests performed by repo server |
argocd_oci_request_duration_seconds |
histogram | Duration of OCI requests performed by the repo server. |
argocd_oci_test_repo_fail_total |
counter | Number of OCI test repo requests failures by repo server |
argocd_oci_get_tags_fail_total |
counter | Number of OCI get tags requests failures by repo server |
argocd_oci_digest_metadata_fail_total |
counter | Number of OCI digest metadata failures by repo server |
argocd_oci_resolve_revision_fail_total |
counter | Number of OCI resolve revision failures by repo server |
argocd_oci_extract_fail_total |
counter | Number of OCI extract requests failures by repo server |
Commit Server Metrics
Metrics about the Commit Server.
Scraped at the argocd-commit-server:8087/metrics endpoint.
| Metric | Type | Description |
|---|---|---|
argocd_commitserver_commit_pending_request_total |
gauge | Number of pending commit requests. |
argocd_commitserver_git_request_duration_seconds |
histogram | Git requests duration seconds. |
argocd_commitserver_git_request_total |
counter | Number of git requests performed by commit server |
argocd_commitserver_commit_request_duration_seconds |
histogram | Commit requests duration seconds. |
argocd_commitserver_userinfo_request_duration_seconds |
histogram | Userinfo requests duration seconds. |
argocd_commitserver_commit_request_total |
counter | Number of commit requests performed by commit server |
Prometheus Operator
If using Prometheus Operator, the following ServiceMonitor example manifests can be used.
Add a namespace where Argo CD is installed and change metadata.labels.release to the name of label selected by your Prometheus.
For a high availability setup where the application controller runs multiple replicas, a ServiceMonitor works as expected because endpoint discovery scrapes every controller pod. Other scrapers that are not based on Prometheus Operator (such as Telegraf or Grafana Agent) should use Kubernetes pod or endpoint discovery rather than a ClusterIP target, as scraping the ClusterIP collects metrics from only one replica per request.
apiVersion: monitoring.coreos.com/v1
kind: ServiceMonitor
metadata:
  name: argocd-metrics
  labels:
    release: prometheus-operator
spec:
  selector:
    matchLabels:
      app.kubernetes.io/name: argocd-metrics
  endpoints:
    - port: metrics
apiVersion: monitoring.coreos.com/v1
kind: ServiceMonitor
metadata:
  name: argocd-server-metrics
  labels:
    release: prometheus-operator
spec:
  selector:
    matchLabels:
      app.kubernetes.io/name: argocd-server-metrics
  endpoints:
    - port: metrics
apiVersion: monitoring.coreos.com/v1
kind: ServiceMonitor
metadata:
  name: argocd-repo-server-metrics
  labels:
    release: prometheus-operator
spec:
  selector:
    matchLabels:
      app.kubernetes.io/name: argocd-repo-server
  endpoints:
    - port: metrics
apiVersion: monitoring.coreos.com/v1
kind: ServiceMonitor
metadata:
  name: argocd-applicationset-controller-metrics
  labels:
    release: prometheus-operator
spec:
  selector:
    matchLabels:
      app.kubernetes.io/name: argocd-applicationset-controller
  endpoints:
    - port: metrics
apiVersion: monitoring.coreos.com/v1
kind: ServiceMonitor
metadata:
  name: argocd-dex-server
  labels:
    release: prometheus-operator
spec:
  selector:
    matchLabels:
      app.kubernetes.io/name: argocd-dex-server
  endpoints:
    - port: metrics
apiVersion: monitoring.coreos.com/v1
kind: ServiceMonitor
metadata:
  name: argocd-redis-haproxy-metrics
  labels:
    release: prometheus-operator
spec:
  selector:
    matchLabels:
      app.kubernetes.io/name: argocd-redis-ha-haproxy
  endpoints:
    - port: http-exporter-port
For notifications controller, you need to additionally add following:
apiVersion: monitoring.coreos.com/v1
kind: ServiceMonitor
metadata:
  name: argocd-notifications-controller
  labels:
    release: prometheus-operator
spec:
  selector:
    matchLabels:
      app.kubernetes.io/name: argocd-notifications-controller-metrics
  endpoints:
    - port: metrics
For the optional Source Hydrator commit server component, you can add the following:
apiVersion: monitoring.coreos.com/v1
kind: ServiceMonitor
metadata:
  name: argocd-commit-server-metrics
  labels:
    release: prometheus-operator
spec:
  selector:
    matchLabels:
      app.kubernetes.io/name: argocd-commit-server
  endpoints:
    - port: metrics
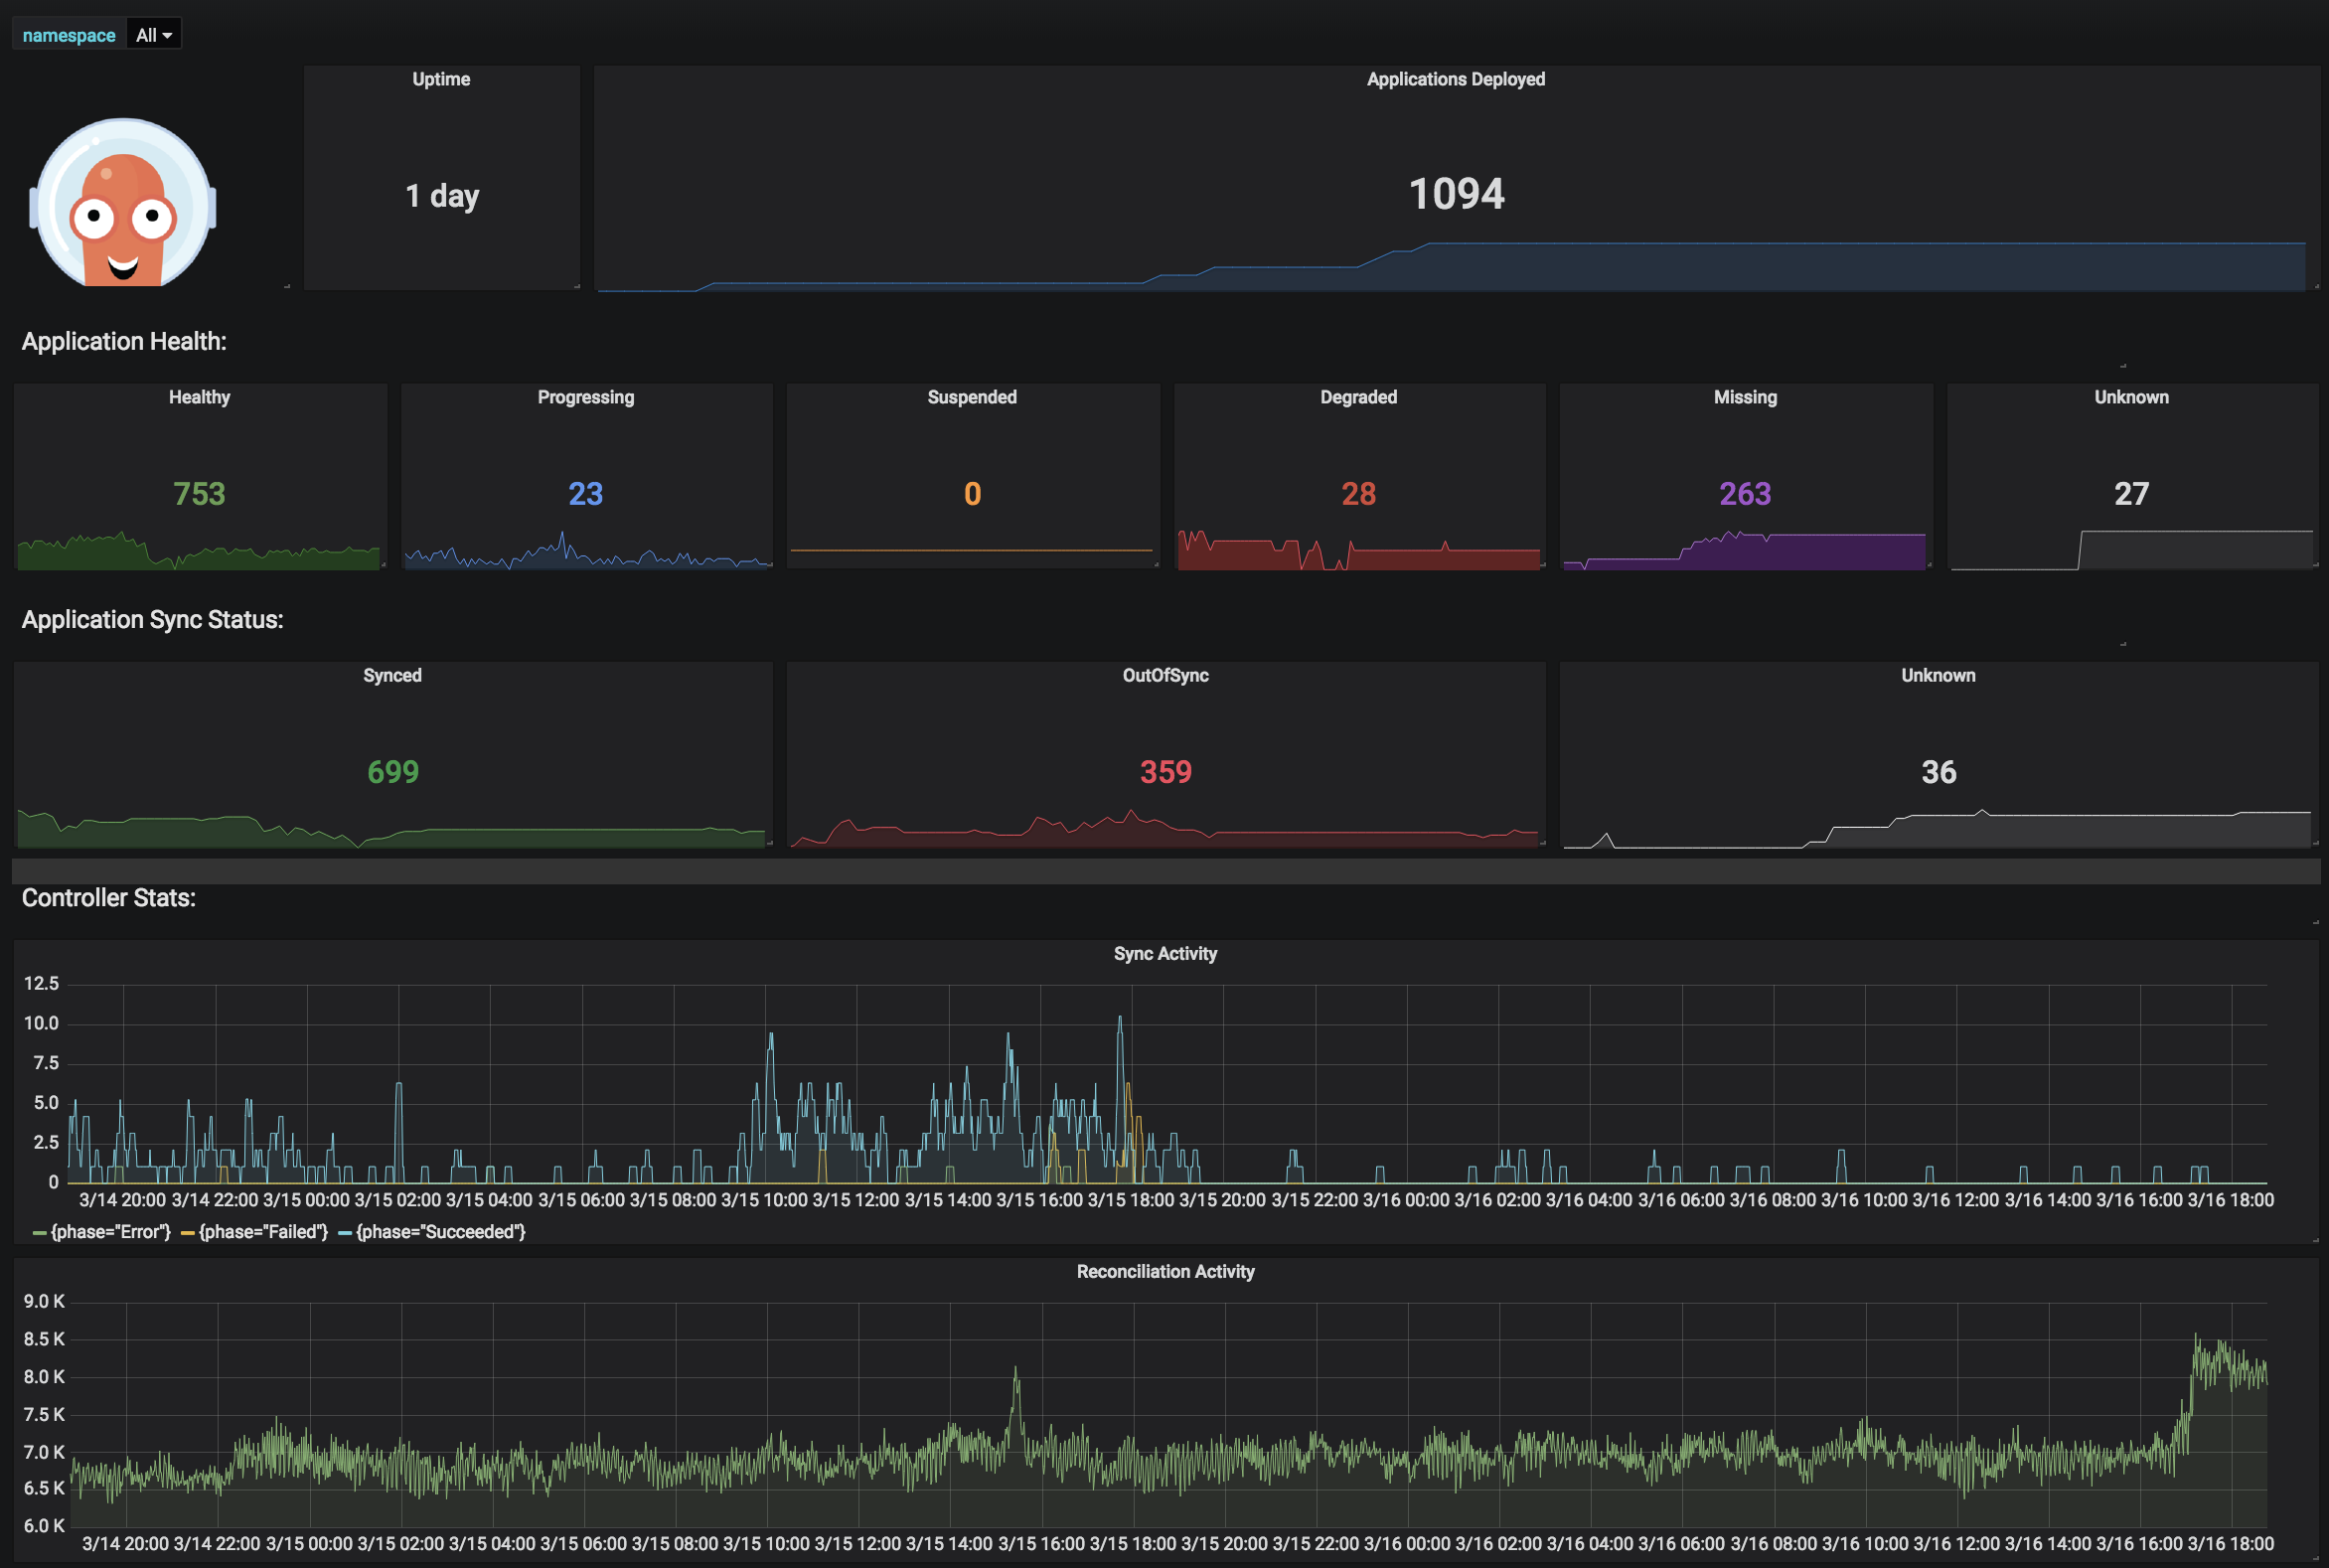
Dashboards
You can find an example Grafana dashboard or check the demo instance dashboard.